
Message boards : Number crunching : Memory requirements for LHC applications
Message board moderation
Previous · 1 · 2 · 3 · Next
| Author | Message |
|---|---|
|
Send message Joined: 13 Apr 18 Posts: 443 Credit: 8,438,885 RAC: 0 |
It works because it uses virtual memory. |
|
Send message Joined: 15 Jun 08 Posts: 2739 Credit: 301,703,192 RAC: 81,503 |
ot derived from "ps" output. It shows the athena.py's RAM usage of my currently running ATLAS tasks. All tasks are configured as 1-core. [pre]RSS SZ TIME CMD 1940168 671547 03:43:31 athena.py 1951584 673631 10:41:06 athena.py 1936860 666560 02:48:04 athena.py 1941340 671465 08:29:34 athena.py 1935816 674120 06:05:43 athena.py 1934604 668748 04:28:52 athena.py 1947408 674032 12:10:12 athena.py 1950740 671555 05:15:06 athena.py 2050688 664636 00:30:58 athena.py 1925380 665146 01:55:18 athena.py 1919436 664700 01:12:31 athena.py 1937184 674515 09:11:52 athena.py 1944524 677326 09:55:58 athena.py 1944788 673375 11:24:08 athena.py 1944080 671754 06:54:16 athena.py 1936132 670034 07:41:02 athena.py[/pre] Unfortunately neither RSS nor SZ do really show the "correct" value. See the thousands of comments regarding "measuring RAM usage" in the WWW (virtual size, shared segments, private size, etc. etc). Even if they would, they only show a distinct moment in the lifetime of every athena.py. |
|
Send message Joined: 9 Dec 14 Posts: 202 Credit: 2,660,212 RAC: 27 |
It works because it uses virtual memory.For a 4-core native ATLAS task, the "top" command shows 4 athena.py processes which need ~30% RAM each (for this particular machine), so a total of 120% RAM, which obviously can't be correct. One of the advantages of the multicore is that RAM is shared between the athena.py processes. This might lead to the discrepancy between the actual needed amount of RAM and the shown one in the "top" command. But still, if someone wants to know if his PC can crunch native ATLAS tasks, your mentioned formula is deceptive. If someone is new here and wants to check if he can run a, e.g., 4-core native ATLAS task with a 8GB RAM machine, he would conclude with your mentioned formula that it is not possible, although it is more than enough. |
|
Send message Joined: 15 Jun 08 Posts: 2739 Credit: 301,703,192 RAC: 81,503 |
For a 4-core native ATLAS task, the "top" command shows 4 athena.py processes which need ~30% RAM each (for this particular machine), so a total of 120% RAM, which obviously can't be correct. YES and NO. The problem is that watching only one of the top values is misleading. In this case it does not show how much RAM is counted multiple times because it is used by shared libraries. One of the advantages of the multicore is that RAM is shared between the athena.py processes. This might lead to the discrepancy between the actual needed amount of RAM and the shown one in the "top" command. Those shared libraries do not only help multicore ATLAS. They are also used if you run multiple 1-core ATLAS concurrently. This is one of the main advantages of native apps versus vbox apps. But still, if someone wants to know if his PC can crunch native ATLAS tasks, your mentioned formula is deceptive. If someone is new here and wants to check if he can run a, e.g., 4-core native ATLAS task with a 8GB RAM machine, he would conclude with your mentioned formula that it is not possible, although it is more than enough. What could be helpful is that you also monitor the amount of free RAM, cache size and used swap. |
|
Send message Joined: 9 Dec 14 Posts: 202 Credit: 2,660,212 RAC: 27 |
What could be helpful is that you also monitor the amount of free RAM, cache size and used swap.Currently I have no access to this particular machine, so I cant tell you/monitor these values. But since the CPU usage (that is shown in the stderr_txt file) is for almost every task > 385% for a 4-core task (e.g. https://lhcathome.cern.ch/lhcathome/result.php?resultid=208242279), probably no swapping takes place. |
|
Send message Joined: 22 Oct 07 Posts: 27 Credit: 808,821 RAC: 0 |
I've incorporated the changes. I'm not sure the sources are still useful, since every entry not has multiple sources, so I'll likely remove those at the last step. ======================================= LHC application multithreaded memory requirements, Single threads applications, VirtualBox or not, are not mentioned here. App: ATLAS VirtualBox64 Forumla: 3000 + 900 * nCPU, megabyte Plan class: vbox64_mt_mcore_atlas Command line: --memory_size_mb megabytes OS: Linux and Windows Source: Yeti setup guide, version 3 App: ATLAS native (not VirtualBox) Formula 100 + 2000 * nCPU, megabytes Plan class: native_mt Command line: --memory_size_mb megabytes OS: Linux only Source: Number Cruching message 37225 App: CMS App: LHCb VirtualBox64 Formula: 748 + 1300 * nCPU, megabytes Plan class: vbox64_mt_mcore_lhcb Command line: --memory_size_mb megabytes OS: Linux and Windows Source: LHCb Application board, message 37105 App: Theory VirtualBox64 Formula: 630 + 100 * nCPU, megabytes Plan class: vbox64_mt_mcore Command line: not needed, memory is computed by server OS: Linux and Windows Source: Number crunching, message 37193 App: Theory VirtualBox32 Formula: 256 + 64 * nCPU, megabytes Plan class: vbox32 Command line: --memory_size_mb megabytes OS: Linux and Windows Source: Number crunching message 37229 |
|
Send message Joined: 15 Jun 08 Posts: 2739 Credit: 301,703,192 RAC: 81,503 |
... probably no swapping takes place. It's not necessarily ATLAS that will be swapped out. Your system will try to find a balance between reducing the cache and swapping out RAM pages that haven't been accessed for longer, probably starting with boot scripts or similar stuff. This balance can be influenced by parameters like "swappiness". Only if you don't have enough RAM to satisfy all currently active processes your system will swap them. This is the point that should be avoided (and it's different on every system). |
|
Send message Joined: 22 Oct 07 Posts: 27 Credit: 808,821 RAC: 0 |
I think we're done. Can someone with the authority please take this last copy and post it as a pinned message? Thanks |
|
Send message Joined: 9 Dec 14 Posts: 202 Credit: 2,660,212 RAC: 27 |
I think we're done. Can someone with the authority please take this last copy and post it as a pinned message?I still think that the mentioned formula for native ATLAS tasks is wrong! It's not necessarily ATLAS that will be swapped out.True. Since I still have no access to the 6GB RAM machine, the folloing values are from a 4-core 8GB RAM machine, which, according to the mentioned formula, should also not be able to run 4-core native ATLAS tasks. The top command shows for a 4-core native ATLAS task: top - 15:51:50 up 1:02, 3 users, load average: 4,87, 5,74, 5,63 Tasks: 238 total, 5 running, 233 sleeping, 0 stopped, 0 zombie %Cpu(s): 1,4 us, 0,5 sy, 98,0 ni, 0,0 id, 0,0 wa, 0,0 hi, 0,0 si, 0,0 st KiB Mem : 8055880 total, 1722144 free, 4131688 used, 2202048 buff/cache KiB Swap: 8263676 total, 8257064 free, 6612 used. 3396372 avail Mem PID USER PR NI VIRT RES SHR S %CPU %MEM TIME+ COMMAND 12793 boinc 39 19 2661932 1,846g 96724 R 99,2 24,0 38:24.48 athena.py 12795 boinc 39 19 2662484 1,841g 97640 R 98,3 24,0 38:27.32 athena.py 12794 boinc 39 19 2662208 1,842g 96476 R 98,1 24,0 38:31.26 athena.py 12792 boinc 39 19 2661656 1,832g 91272 R 95,7 23,8 38:24.15 athena.py 1695 user 20 0 3187056 92364 59832 S 2,1 1,1 3:25.62 kwin_x11 1709 user 20 0 4591228 205860 95756 S 1,8 2,6 1:56.66 plasmashell 632 root 20 0 386968 96460 63920 S 1,5 1,2 4:44.54 Xorg 1697 root 20 0 441096 8108 6252 S 1,0 0,1 0:00.91 udisksd 2200 user 20 0 2312260 81116 67628 S 0,4 1,0 0:22.24 boincmgr 10829 root 20 0 1004540 313696 11596 S 0,4 3,9 2:04.87 savscand 2203 user 20 0 581716 62712 52692 S 0,3 0,8 0:11.70 konsole 18145 user 20 0 45080 3864 3068 R 0,2 0,0 0:00.06 top 753 boinc 30 10 285464 15788 12264 S 0,1 0,2 0:13.10 boinc 861 sophosav 20 0 1266080 15360 12892 S 0,1 0,2 0:02.71 mrouter 1182 sophosav 20 0 810228 19516 16032 S 0,1 0,2 0:04.30 magent 1711 user 20 0 503692 31044 27552 S 0,1 0,4 0:03.27 xembedsniproxy 3278 boinc 30 10 13468 2960 2496 S 0,1 0,0 0:03.99 wrapper_26015_xSo basically no swap is used, free memory is about 1.7GB, available memory is over 3GB and cached memory is over 2GB. The high load average probably comes from the fact that I used the PC for other stuff as well while the simulation was runnning. |
|
Send message Joined: 16 Jul 05 Posts: 24 Credit: 35,251,537 RAC: 0 |
I agree - I've run 4-core native Atlas on (dedicated) 4 GB machines without significantly worse throughput than 8 GB boxes. I can't though see an easy way to figure the formula out...I think we're done. Can someone with the authority please take this last copy and post it as a pinned message?I still think that the mentioned formula for native ATLAS tasks is wrong! Unfortunately I've left the institution, the BITlab project is gone, and the machines are no doubt heading ever-closer to the skip; otherwise I'd have tried running a 1-core Atlas on one of the 2GB boxes, just to see what happens. (I will admit I was slightly surprised to be getting 4x Athena.py on the 4GB machines. But IIRC the "overhead" (BOINC client, CVMFS, other Atlas processes) was only few hundred MB, and maybe I was just lucky to hit a bunch of undemanding tasks). |
|
Send message Joined: 13 Apr 18 Posts: 443 Credit: 8,438,885 RAC: 0 |
I see a top report similar to gyllic's on my 8GB RAM host with 2 X 2-cpu native tasks running plus a few other apps. ATM I see ~1 GB smaller cache and slightly higher swap and free numbers.I agree - I've run 4-core native Atlas on (dedicated) 4 GB machines without significantly worse throughput than 8 GB boxes. I can't though see an easy way to figure the formula out...I think we're done. Can someone with the authority please take this last copy and post it as a pinned message?I still think that the mentioned formula for native ATLAS tasks is wrong! I think gyllic is right. 2100 is maybe too cautious. How about this for the native ATLAS formula r1 + r2 * (ncpus - 1) where: 1700 =< r1 =< 2100, 1400 =< r2 =< 1700 which allows the formula to be tweaked from conservative: 2100 + 1700 (ncpus - 1) to more aggressive: 1700 + 1400 (ncpus - 1) |
|
Send message Joined: 16 Jul 05 Posts: 24 Credit: 35,251,537 RAC: 0 |
I can't though see an easy way to figure the (native Atlas) formula out...Thinking about it, this may be harder than I thought as part of what Condor does is to summarise the local resources available and then fetch tasks that match, so and maybe I was just lucky to hit a bunch of undemanding tasks).was actually the whole system doing the right thing by sending smaller tasks to low-spec machines. So then the formula will depend on the "smallest" sub-task that the project is willing to issue ... maybe an Atlas person could comment? I can envisage a minimalist formula of say 300MB + (1024MB*nCores) to get some native jobs on low-spec machines, but then there might be a lot of idle time once the small sub-tasks run out. |
|
Send message Joined: 9 Dec 14 Posts: 202 Credit: 2,660,212 RAC: 27 |
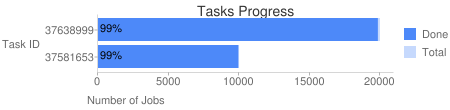
ATLAS works differently compared to the other vbox apps like Theory, LHCb or CMS. ATLAS tasks don't use HTCondor or something like that, so the job distribution is done by the boinc server. Here you can see which task IDs are currently crunched by LHC@home ATLAS tasks https://lhcathome.cern.ch/lhcathome/img/progresschart.png. To see more details on that you can go to https://bigpanda.cern.ch/ (you maybe get an invalid/insecure SSL certification issue which can be solved easily). No difference is made between low-spec and high-spec machines regarding which tasks are sent to the machines. |
|
Send message Joined: 13 Apr 18 Posts: 443 Credit: 8,438,885 RAC: 0 |
@gyllic 300MB + (1024MB*nCores) <=> 1324 for the first thread, 1024 for each additional Should it be that low? If nobody objects then let's make it 300MB + (1024MB*nCores) |
|
Send message Joined: 9 Dec 14 Posts: 202 Credit: 2,660,212 RAC: 27 |
@gyllicI have not tested this formula, so I can't give you an answer. Unfortunately I don't have the time to look into this deeper/test this out at the moment. But if you want and if you have the time for it, you could test your mentioned formula since you are running native ATLAS tasks ;-). Try to variate the #cores/task and compare the value from your function with the actual amount of needed RAM. |
|
Send message Joined: 13 Apr 18 Posts: 443 Credit: 8,438,885 RAC: 0 |
you could test your mentioned formula since you are running native ATLAS tasks OK, I did some testing on hostID 10541232 . It has 4 cores (no HT) and 8 GB RAM. The method consisted of: 1) reboot the host and start BOINC (client and manager), a script that counts ATLAS events as they process and a terminal 2) get a report from top to establish baseline RAM usage (t0) 3) start 2 X 2-core ATLAS tasks, wait until all 4 threads are processing events 4) get a top report (t1) 5) run the 2 X 2-core tasks to completion, start 4 X 1-core tasks, wait until all 4 threads are processing events 6) get a top report (t2) The top reports: t0 top - 08:09:47 up 10 min, 1 user, load average: 1.08, 0.50, 0.29 Tasks: 274 total, 1 running, 218 sleeping, 0 stopped, 0 zombie %Cpu(s): 2.5 us, 0.7 sy, 2.9 ni, 93.7 id, 0.2 wa, 0.0 hi, 0.1 si, 0.0 st KiB Mem : 8071700 total, 5512460 free, 1197408 used, 1361832 buff/cache KiB Swap: 8291324 total, 8291324 free, 0 used. 6044816 avail Mem t1 top - 09:33:50 up 1:35, 1 user, load average: 6.36, 5.04, 4.53 Tasks: 327 total, 6 running, 265 sleeping, 0 stopped, 0 zombie %Cpu(s): 1.2 us, 0.8 sy, 85.4 ni, 12.5 id, 0.1 wa, 0.0 hi, 0.0 si, 0.0 st KiB Mem : 8071700 total, 128380 free, 6194824 used, 1748496 buff/cache KiB Swap: 8291324 total, 8289020 free, 2304 used. 969640 avail Mem t2 top - 16:31:59 up 8:33, 1 user, load average: 4.68, 4.70, 4.62 Tasks: 367 total, 5 running, 303 sleeping, 0 stopped, 1 zombie %Cpu(s): 1.5 us, 1.0 sy, 85.9 ni, 10.7 id, 0.8 wa, 0.0 hi, 0.1 si, 0.0 st KiB Mem : 8071700 total, 155328 free, 7343100 used, 573272 buff/cache KiB Swap: 8291324 total, 5182716 free, 3108608 used. 255428 avail Mem So that's the data, here's my analysis. For 2 X 2-core tasks: Mem = mem used(t1) - mem used (t0) = 6194824 - 1197408 = ~5GB (a) Swap = swap used(t1) - swap used(t0) = 2304 - 0 = ~2.3 MB For 4 X 1-core tasks: Mem = mem used(t1) - mem used (t0) = 7343100 used - 1197408 = ~6.1 GB (b) Swap = swap used(t1) - swap used(t0) = 3108608 - 0 = ~3 GB From (a)...RAM required for a 2 core task is 5 / 2 = 2.5 GB (c) From (b)... RAM required for a 1-core task is 6 / 4 = 1.25 GB (d) From (c) and (d) we might conclude that the formula should be 1250 + 1250 * (ncpus - 1) except we won't conclude that because we are taught that after the first thread the next threads require less. And besides I have other top reports acquired as per the method above that indicate (by similar logic) that the formula should be 1300 + 1000 * (ncpus -1) which is equivalent to 300 + 1000 * ncpus which is equivalent to 1300 for the first thread + 1000 per each additional thread. So what should the formula be for native ATLAS? I agree with gyllic that it should reflect the fact that 2 X 2-core tasks will fit in 8 GB or even 6 GB. My recommendation is 300 + 1000 * ncpus. |
|
Send message Joined: 16 Jul 05 Posts: 24 Credit: 35,251,537 RAC: 0 |
(I've spotted a suitable machine to play with, but that's weeks rather than hours away) Looking at the output from ps aux there was some obvious overhead (BOINC client, CVMFS, MemoryMonitor etc.), and then a set of nCPU athena.py doing the work with resources (CPU, memory) split evenly between them. So my inclination would be to express the correlation as overhead + (memory * nCPU). NB this is from (human) memory and for native Atlas native jobs (no Singularity). I can't recall what the Singularity ones looked like. |
|
Send message Joined: 9 Dec 14 Posts: 202 Credit: 2,660,212 RAC: 27 |
@bronco: thanks for your work! Your mentioned formula probably goes in the right direction. Maybe I find some time in the next couple of days to do some tests as well (from 1-core to 4-core tasks) to get more data. Will take a couple of days though... @BITLab Argo: Using singularity probably won't have big effects on the used/required memory (just a guess). Maybe the file "memory_monitor_output.txt" within the PandaJob directory within the boinc's slot directory gives helpful informations to more advanced linux users. |
|
Send message Joined: 16 Jul 05 Posts: 24 Credit: 35,251,537 RAC: 0 |
Using singularity probably won't have big effects on the used/required memory (just a guess).I agree - the 4GB boxes I mentioned below should have been using it because of the OS - but I was rather pointing out that the list of tasks that the user will see could look very different, in case anyone else is having a look. |
|
Send message Joined: 9 Dec 14 Posts: 202 Credit: 2,660,212 RAC: 27 |
I get different numbers than bronco, but thats probably because bronco has not considered the data that has been swapped out in the 4x1-core tasks case, see below. The used machine is a dedicated, headless machine that is only used for native ATLAS tasks. The test procedure was very similar to bronco’s: Reboot the machine, check the “used memory†value from the “top†command, start a new native ATLAS task, check the “used memory†output after ~2 hours of runtime (wall clock time), wait until the task finished, reboot machine again, and so on. So the only value that is taken into account here is the “used memory†output from the “top†command. This was done for one 1-core, two 2-core, one 3-core and one 4-core tasks. All tasks were from the same task ID. But the memory requirements probably won’t change hugely with different task IDs? Here are the numbers (I have rounded some of the values to get nicer numbers which lead to entire memory is not equal to free+avail+...): After restart (~constant for all reboots): KiB Mem : 6106000 total, 5870900 free, 110828 used, 124012 buff/cache KiB Swap: 6280000 total, 6280000 free, 0 used. 5799740 avail Mem With one 1-core task: KiB Mem : 6106000 total, 714116 free, 2346892 used, 3044732 buff/cache KiB Swap: 6280000 total, 6280000 free, 0 used. 3480912 avail Mem==> ( 2346892 - 110828)/1024 ~ 2200MB RAM used by one 1-core native ATLAS task. Bronco calculated 1250MB RAM for a 1-core task based on the 6100MB RAM that were used. But if we consider the swapped data the “RAM used†would get to ~ “(6100MB+3000MB)/4 ~ 2300MB†which is much closer to my values. With two concurrently 2-core tasks: KiB Mem : 6106000 total, 140884 free, 5037536 used, 927320 buff/cache KiB Swap: 6280000 total, 6270268 free, 9732 used. 824744 avail Mem==> ((5037536 – 110828)/2)/1024 ~ 2400MB RAM used by one 2-core native ATLAS task. Relatively good agreement with bronco’s data. With one 3-core task: KiB Mem : 6106000 total, 329500 free, 2814716 used, 2961520 buff/cache KiB Swap: 6280000 total, 6280000 free, 0 used. 3014728 avail Mem==> ( 2814716 - 110828)/1024 ~ 2600MB RAM used by one 3-core native ATLAS task With one 4-core task: KiB Mem : 6106000 total, 337988 free, 3010464 used, 2757288 buff/cache KiB Swap: 6280000 total, 6280000 free, 0 used. 2820824 avail Mem==> ( 3010464 - 110828)/1024 ~ 2800MB RAM used by one 4-core native ATLAS task Formula suggestion for native ATLAS tasks with some additional safety margin and considering the fact that the longer the tasks run the more memory they need (at least the “used memory†value rises with run time): 2100MB + 300MB*nCPUs |

©2026 CERN