|
1)
Message boards :
ATLAS application :
ATLAS native_mt fail
(Message 35543)
Posted 17 Jun 2018 by PHILIPPE Post: I see other hosts where native application fails. Host 1 ID: 10511353 Details | Tasks Cross-project stats: BOINCstats.com Free-DC 9 9,352.80 1,304,278 7.8.4 GenuineIntel Intel(R) Xeon(R) CPU E5-2630 v3 @ 2.40GHz [Family 6 Model 63 Stepping 2] (32 processors) --- Linux CentOS CentOS Linux release 7.4.1708 (Core) [3.10.0-514.26.2.el7.x86_64] 17 Jun 2018, 14:00:28 UTC Host 2 ID: 10511351 Details | Tasks Cross-project stats: BOINCstats.com Free-DC 254 10,101.40 1,276,884 7.8.4 GenuineIntel Intel(R) Xeon(R) CPU E5-2630 v3 @ 2.40GHz [Family 6 Model 63 Stepping 2] (32 processors) --- Linux CentOS CentOS Linux release 7.4.1708 (Core) [3.10.0-514.26.2.el7.x86_64] 17 Jun 2018, 13:05:03 UTC Host 3 ID: 10511349 Details | Tasks Cross-project stats: BOINCstats.com Free-DC 346 10,209.53 1,243,281 7.8.4 GenuineIntel Intel(R) Xeon(R) CPU E5-2630 v3 @ 2.40GHz [Family 6 Model 63 Stepping 2] (32 processors) --- Linux CentOS CentOS Linux release 7.4.1708 (Core) [3.10.0-514.26.2.el7.x86_64] 17 Jun 2018, 12:42:55 UTC Host 4 ID: 10511348 Details | Tasks Cross-project stats: BOINCstats.com Free-DC 539 9,979.68 1,237,588 7.8.4 GenuineIntel Intel(R) Xeon(R) CPU E5-2630 v3 @ 2.40GHz [Family 6 Model 63 Stepping 2] (32 processors) --- Linux CentOS CentOS Linux release 7.4.1708 (Core) [3.10.0-514.26.2.el7.x86_64] 17 Jun 2018, 11:39:32 UTC There are the same lines in the log which displays : Host 5 ID: 10511352 Details | Tasks Cross-project stats: BOINCstats.com Free-DC 601 10,301.15 1,275,983 7.8.4 GenuineIntel Intel(R) Xeon(R) CPU E5-2630 v3 @ 2.40GHz [Family 6 Model 63 Stepping 2] (32 processors) --- Linux CentOS CentOS Linux release 7.4.1708 (Core) [3.10.0-514.26.2.el7.x86_64] 17 Jun 2018, 11:07:29 UTC Host 6 ID: 10511347 Details | Tasks Cross-project stats: BOINCstats.com Free-DC 682 10,034.29 1,281,656 7.8.4 GenuineIntel Intel(R) Xeon(R) CPU E5-2630 v3 @ 2.40GHz [Family 6 Model 63 Stepping 2] (32 processors) --- Linux CentOS CentOS Linux release 7.4.1708 (Core) [3.10.0-514.26.2.el7.x86_64] 17 Jun 2018, 10:23:36 UTC In their logs appears the same lines : <core_client_version>7.8.4</core_client_version> Other similar hosts works fine but have this line instead of the red above : <core_client_version>7.8.4</core_client_version> Is it the reason for the constant failure ? |
|
2)
Message boards :
Cafe LHC :
World cup Russia 2018
(Message 35529)
Posted 15 Jun 2018 by PHILIPPE Post: Which country will win the world cup russia 2018 ?
                           -------------------
                            My World Cup Team
                           -------------------


                                                                 |_|
           _          _          _          _          _         ].[
          |.|        |.|        |.|        |.|        |.|      /~`-'~\
          ]^[        ]^[        ]^[        ]^[        ]^[     (<|%  |>)
        /~`-'~\    /~`-'~\    /~`-'~\    /~`-'~\    /~`-'~\    \|___|/
       {<|%  |>}  {<|%  |>}  {<|%  |>}  {<|%  |>}  {<|%  |>}   {/   \}
        \|___|/    \|___|/    \|___|/    \|___|/    \|___|/    /__|__\
       /\    \      /   \      /   \      /   \      /   \     | / \ |
       |/>/|__\    /__|__\    /__|__\    /__|__\    /__|__\    |/   \|
      _|)   \ |    | / \ |    | / \ |    | / \ |    | / \ |    {}   {}
     (_,|    \)    (/   \)    (/   \)    (/   \)    (/   \)    |)   (|
     / \     (|_  _|)   (|_  _|)   (|_  _|)   (|_  _|)   (|_  _||   ||_
  .,.\_/,...,|,_)(_,|,.,|,_)(_,|,.,|,_)(_,|,.,|,_)(_,|,.,|,_)(_,|.,.|,_).,.


            _        _             _             _        _
           |.|      |.|           |.|           |.|      |.|
          _]^[_    _]^[_         _]^[_         _]^[_    _]^[_
         / %   \  / %   \       /;;;;;\       / %   \  / %   \
       _(<__,_/_)(_\_,__>)_   _<;\;;;/;>_   _(<__,_/_)(_\_,__>)_
      /\\_\  \_>  <_/  /_//\ (  \;>;<;/  ) /\\_\  \_>  <_/  /_//\
      |,\_/|___\  /___|\_/,|  \ \\ __ / /  |,\_/|___\  /___|\_/,|
     _|/   (__<_  _>__)   \|_  >|     |<  _|/   (__<_  _>__)   \|_
    (_,]     /_/  \_\     \,_)(_;     ;_)(_,]     /_/  \_\     \,_)
In order to check if a crowd can guess the winner and give the right answer to this question , i ask to everyone who want to play to this bet to give four names of country selected for this competition. If you don't know them , here are their names ; the number beside is their world fifa ranking at this moment. AFC (5) Australia (36) Iran (37) Japan (61) Saudi Arabia (67) South Korea (57) CAF (5) Egypt (45) Morocco (41) Nigeria (48) Senegal (27) Tunisia (21) CONCACAF (3) Costa Rica (23) Mexico (15) Panama (55) CONMEBOL (5) Argentina (5) Brazil (2) Colombia (16) Peru (11) Uruguay (14) OFC (0) None qualified UEFA (14) Belgium (3) Croatia (20) Denmark (=12) England (=12) France (7) Germany (1) Iceland (22) Poland (8) Portugal (4) Russia (70) (hosts) Serbia (34) Spain (10) Sweden (24) Switzerland (6) So , if you want to participate , give 4 names of the upper list , if you think that these countries will be in the top 4. At the end , i will add each name and order them , to give the winner given by the members of this forum. You can play only one time, of course. You have 2 weeks. Optionnaly , you can put an * behind the country you think it will win the competition. There is nothing to win for the moment , it is just to check if a crowd can go near the solution.But i will say if someone have find the right country at the end. So i begin : France * , Brazil , Russia , Germany . Good luck to all players.Important is to participate... |
|
3)
Message boards :
ATLAS application :
ATLAS issues
(Message 35476)
Posted 10 Jun 2018 by PHILIPPE Post: Hello this is maybe an error of communication between the vboxwrapper and virtualbox. ERROR: Vboxwrapper lost communication with VirtualBox, rescheduling task for a later time BOINC will be notified that it needs to clean up the environment. This is a temporary problem and so this job will be rescheduled for another time. To solve it : Go to the VirtualBox Manager and then File/VB Media Manager/ and in that box you may find some vdi's that need to be removed since they can mess up the new tasks trying to get a slot to use. This is what you do not want to see.....and the good and the bad there  Erase all the vdis which have a yellow triangle and keep only the one with a green triangle.Don't touch the others. It will cleanup your environment. It happens sometimes to delete manualy some of them in virtualbox manager , when boinc fails to delete the vdis. |
|
4)
Message boards :
LHCb Application :
Zero CPU usage
(Message 35464)
Posted 9 Jun 2018 by PHILIPPE Post: Just for information : a plot over a sliding period of one week which displays the average cpu efficiency for all boinc volunteers with LHCb work units: Apparently ,it's not possible to separate by lengh time of tasks to display results. |
|
5)
Message boards :
ATLAS application :
Different VirtualBox behavior with linux and windows hosts
(Message 35332)
Posted 21 May 2018 by PHILIPPE Post: I have followed 3 hosts with same hardware features and configuration (around 26/04/2018). 2 of them are linux hosts which switched between native application linux and VirtualBox software. The 3rd was running windows with VirtualBox. Features of 3 hosts running 4-cores work units: ID: 10391087 (linux with 72 processors) Details | Tasks 1 Anonymous 35,455.02 12,488,165 7.6.31 GenuineIntel Intel(R) Xeon(R) CPU E5-2696 v3 @ 2.30GHz [Family 6 Model 63 Stepping 2] (72 processors) [2] NVIDIA GeForce GTX 1080 (4095MB) driver: 378.13 OpenCL: 1.2 Linux 4.4.0-104-generic Average upload rate 1112.15 KB/sec VirtualBox VboxManage Interface (Version: 5.2.6) ID: 10400117 (linux with 36 processors) Details | Tasks 16 Anonymous 17,054.56 5,656,545 7.6.31 GenuineIntel Intel(R) Xeon(R) CPU E5-2696 v3 @ 2.30GHz [Family 6 Model 63 Stepping 2] (36 processors) NVIDIA GeForce GTX 970 (4034MB) driver: 384.11 OpenCL: 1.2 Linux 4.4.0-108-generic Average upload rate 542.94 KB/sec VirtualBox VboxManage Interface (Version: 5.2.6) ID: 10506243 (windows with 36 processors) Details | Tasks 22 Anonymous 14,435.86 3,036,175 7.8.3 GenuineIntel Intel(R) Xeon(R) CPU E5-2696 v3 @ 2.30GHz [Family 6 Model 63 Stepping 2] (36 processors) NVIDIA GeForce GTX 970 (4095MB) driver: 388.31 OpenCL: 1.2 Microsoft Windows 10 Core x64 Edition, (10.00.16299.00) Average upload rate 418.34 KB/sec VirtualBox COM Interface (Version: 5.1.30) Datas recorded on the site , sorted by ascending order of efficiency: 10391087 (linux with 72 processors) run time cpu time efficiency application 43920,53 100111,1 0,57 vb 28015,64 63397,32 0,57 vb 27500,23 62383,45 0,57 vb 42479,20 96395,74 0,57 vb 32957,73 74989,93 0,57 vb 26149,97 59548,46 0,57 vb 29135,31 66353,59 0,57 vb 26416,57 60600,05 0,57 vb 23833,43 58114,87 0,61 vb 24553,68 60267,45 0,61 vb 15453,28 57939,67 0,94 native 11367,06 43172,74 0,95 native 15501,01 59259,57 0,96 native 11417,63 43670,79 0,96 native 14665,78 56135,68 0,96 native 14286,73 55037,48 0,96 native 19641,19 75800,60 0,96 native 15857,75 61283,64 0,97 native 18880,20 73188,00 0,97 native 10400117 (linux with 36 processors) run time cpu time efficiency application 27244,07 73584,22 0,68 vb 27212,46 73848,47 0,68 vb 27303,76 73899,43 0,68 vb 27301,73 74041,98 0,68 vb 17755,47 56687,68 0,80 vb 17845,35 56441,30 0,79 vb 17588,68 55602,94 0,79 vb 17354,07 54766,45 0,79 vb 19556,11 74582,10 0,95 native 19419,92 75094,64 0,97 native 19549,29 75909,89 0,97 native 18941,23 73104,08 0,96 native 19762,74 75918,46 0,96 native 14899,92 57585,83 0,97 native 15451,20 59097,37 0,96 native 15207,48 57780,46 0,95 native 10506243 (windows with 36 processors) run time cpu time efficiency 21305,35 79766,66 0,94 20614,23 77333,95 0,94 15485,98 58339,94 0,94 15307,02 57672,48 0,94 15457,07 58237,94 0,94 15586,40 58834,28 0,94 19643,13 74370,30 0,95 15155,82 57471,86 0,95 20232,69 76807,64 0,95 18960,37 72407,94 0,95 27130,88 104066,7 0,96 21662,46 83098,69 0,96 25821,20 99107,42 0,96 22404,23 86214,14 0,96 25778,69 99250,48 0,96 25768,48 99634,19 0,97 The results are : average cpu efficiency : linux id host native vb Variation % 10391087 0,96 0,58 -39,58 10400117 0,96 0,73 -23,96 windows id host vb 10506243 0,95 The main question is "why" ? The difference in cpu efficiency between linux native application and virtualbox for linux host is already known , but the value is greatly different according to the number of processors included in linux host: A reduction of 24 % for a 36 processors host and 40 % for a 72 processors.(when processors number multiplied by 2 , variation between native and virtual box multiplied by 2). Is there an explanation ? It sounds like processes are shared between running VMs , but normally a VM is isolated from another one... Why do windows hosts behave differently ? (No difference in cpu efficiency between native application and windows + VirtualBox on a 36 processors)? The hardware is the same for these 3 hosts.(Same cpu and frequency clock).(same 4-cores work units).(same virtualbox version for the 2 linux hosts).(bandwith x2 for 72 processors). It's difficult to think that running a guest linux inside virtualbox is easier with a windows host(with many services in background) than with a linux host (where normally you can set every daemon). Is there a parameter "forgotten" to set up for the linux guest or the linux host, to improve the situation ? I remain perplexed. "Maybe" virtualbox developpers should have a look into it if they really want to have a multi-platform application ? The conclusion seems to be : Linux hosts (with or without numerous processors ?) would rather install linux native application instead of VirtualBox (... if they want to run only ATLAS work units).(waiting for a VirtualBox improvement). |
|
6)
Message boards :
ATLAS application :
only half of credit for 4-core task - compared to 2-core task
(Message 35313)
Posted 19 May 2018 by PHILIPPE Post: Thanks a lot, computezrmle , to have spent a little of your time , to answer me. I believe i have understood the method you use , to determine the iddle period of each core (average and equally share among cores ,except core0). Each day , we learn about each other. It's not always easy to interpret the results obtained.But I was a bit surprised about the high values recorded for the cpu efficiency whereas some other hosts are lower . |
|
7)
Message boards :
ATLAS application :
only half of credit for 4-core task - compared to 2-core task
(Message 35310)
Posted 19 May 2018 by PHILIPPE Post: Thanks to answer me , but to be honest , i have some difficulties to understand where you choose the beginning of the elapsed time and its end , and how you can determine the period the idle core, have inside the VM. Better is to take an example ,to show clearly how you do : Here is one Erich's log , i added rank line before to give it easier to understand and speak about. 1 <core_client_version>7.6.22</core_client_version> 2 <![CDATA[ 3 <stderr_txt> 4 2018-05-18 14:05:59 (4636): vboxwrapper (7.7.26196): starting 5 2018-05-18 14:05:59 (4636): Feature: Checkpoint interval offset (235 seconds) 6 2018-05-18 14:05:59 (4636): Detected: VirtualBox COM Interface (Version: 5.1.38) 7 2018-05-18 14:05:59 (4636): Detected: Minimum checkpoint interval (900.000000 seconds) 8 2018-05-18 14:05:59 (4636): Successfully copied 'init_data.xml' to the shared directory. 9 2018-05-18 14:05:59 (4636): Create VM. (boinc_cbf3fadcc7133493, slot#5) 10 2018-05-18 14:05:59 (4636): Setting Memory Size for VM. (4800MB) 11 2018-05-18 14:05:59 (4636): Setting CPU Count for VM. (2) 12 2018-05-18 14:05:59 (4636): Setting Chipset Options for VM. 13 2018-05-18 14:05:59 (4636): Setting Boot Options for VM. 14 2018-05-18 14:05:59 (4636): Enabling VM Network Access. 15 2018-05-18 14:05:59 (4636): Setting Network Configuration for NAT. 16 2018-05-18 14:05:59 (4636): Disabling USB Support for VM. 17 2018-05-18 14:05:59 (4636): Disabling COM Port Support for VM. 18 2018-05-18 14:05:59 (4636): Disabling LPT Port Support for VM. 19 2018-05-18 14:05:59 (4636): Disabling Audio Support for VM. 20 2018-05-18 14:05:59 (4636): Disabling Clipboard Support for VM. 21 2018-05-18 14:05:59 (4636): Disabling Drag and Drop Support for VM. 22 2018-05-18 14:05:59 (4636): Adding storage controller(s) to VM. 23 2018-05-18 14:05:59 (4636): Adding virtual disk drive to VM. (vm_image.vdi) 24 2018-05-18 14:06:02 (4636): Adding VirtualBox Guest Additions to VM. 25 2018-05-18 14:06:02 (4636): Adding network bandwidth throttle group to VM. (Defaulting to 1024GB) 26 2018-05-18 14:06:02 (4636): forwarding host port 2053 to guest port 80 27 2018-05-18 14:06:02 (4636): Enabling remote desktop for VM. 28 2018-05-18 14:06:02 (4636): Enabling shared directory for VM. 29 2018-05-18 14:06:02 (4636): Starting VM. (boinc_cbf3fadcc7133493, slot#5) 30 2018-05-18 14:06:27 (4636): Guest Log: BIOS: VirtualBox 5.1.38 31 2018-05-18 14:06:27 (4636): Guest Log: BIOS: ata0-0: PCHS=16383/16/63 LCHS=1024/255/63 32 2018-05-18 14:06:27 (4636): Guest Log: BIOS: Boot : bseqnr=1, bootseq=0032 33 2018-05-18 14:06:27 (4636): Guest Log: BIOS: Booting from Hard Disk... 34 2018-05-18 14:06:27 (4636): Guest Log: BIOS: KBD: unsupported int 16h function 03 35 2018-05-18 14:06:27 (4636): Guest Log: BIOS: AX=0305 BX=0000 CX=0000 DX=0000 36 2018-05-18 14:06:27 (4636): Successfully started VM. (PID = '4112') 37 2018-05-18 14:06:27 (4636): Reporting VM Process ID to BOINC. 38 2018-05-18 14:06:37 (4636): VM state change detected. (old = 'poweroff', new = 'running') 39 2018-05-18 14:06:47 (4636): Detected: Web Application Enabled (http://localhost:2053) 40 2018-05-18 14:06:47 (4636): Detected: Remote Desktop Enabled (localhost:2054) 41 2018-05-18 14:06:57 (4636): Preference change detected 42 2018-05-18 14:06:57 (4636): Setting CPU throttle for VM. (100%) 43 2018-05-18 14:06:57 (4636): Setting checkpoint interval to 900 seconds. (Higher value of (Preference: 60 seconds) or (Vbox_job.xml: 900 seconds)) 44 2018-05-18 14:07:57 (4636): Guest Log: vboxguest: major 0, IRQ 20, I/O port d020, MMIO at 00000000f0400000 (size 0x400000) 45 2018-05-18 14:08:07 (4636): Guest Log: VBoxGuest: VBoxGuestCommonGuestCapsAcquire: pSession(0xffff88013dff3c10), OR(0x0), NOT(0xffffffff), flags(0x0) 46 2018-05-18 14:08:07 (4636): Guest Log: VBoxGuest: VBoxGuestCommonGuestCapsAcquire: pSession(0xffff8801402bf210), OR(0x0), NOT(0xffffffff), flags(0x0) 47 2018-05-18 14:08:07 (4636): Guest Log: VBoxGuest: VBoxGuestCommonGuestCapsAcquire: pSession(0xffff88013dff2e10), OR(0x0), NOT(0xffffffff), flags(0x0) 48 2018-05-18 14:08:07 (4636): Guest Log: VBoxGuest: VBoxGuestCommonGuestCapsAcquire: pSession(0xffff88013dff2010), OR(0x0), NOT(0xffffffff), flags(0x0) 49 2018-05-18 14:08:47 (4636): Guest Log: Copying input files into RunAtlas. 50 2018-05-18 14:08:57 (4636): Guest Log: Copied input files into RunAtlas. 51 2018-05-18 14:09:07 (4636): Guest Log: copied the webapp to /var/www 52 2018-05-18 14:09:07 (4636): Guest Log: This vm does not need to setup http proxy 53 2018-05-18 14:09:07 (4636): Guest Log: ATHENA_PROC_NUMBER=2 54 2018-05-18 14:09:07 (4636): Guest Log: Starting ATLAS job. (PandaID=3931045702 taskID=14073742) 55 2018-05-18 15:47:06 (4636): Status Report: Elapsed Time: '6009.312498' 56 2018-05-18 15:47:06 (4636): Status Report: CPU Time: '11181.234375' 57 2018-05-18 17:27:06 (4636): Status Report: Elapsed Time: '12009.640625' 58 2018-05-18 17:27:06 (4636): Status Report: CPU Time: '23194.265625' 59 2018-05-18 19:07:07 (4636): Status Report: Elapsed Time: '18010.000000' 60 2018-05-18 19:07:07 (4636): Status Report: CPU Time: '35216.156250' 61 2018-05-18 20:30:27 (4636): Guest Log: BIOS: AX=0305 BX=0000 CX=0000 DX=0000 62 2018-05-18 20:47:07 (4636): Status Report: Elapsed Time: '24010.609373' 63 2018-05-18 20:47:07 (4636): Status Report: CPU Time: '47249.968750' 64 2018-05-18 22:27:07 (4636): Status Report: Elapsed Time: '30010.921875' 65 2018-05-18 22:27:07 (4636): Status Report: CPU Time: '59291.468750' 66 2018-05-19 00:07:08 (4636): Status Report: Elapsed Time: '36011.187498' 67 2018-05-19 00:07:08 (4636): Status Report: CPU Time: '71325.062500' 68 2018-05-19 01:47:08 (4636): Status Report: Elapsed Time: '42011.671875' 69 2018-05-19 01:47:08 (4636): Status Report: CPU Time: '83361.421875' 70 2018-05-19 03:27:08 (4636): Status Report: Elapsed Time: '48011.937498' 71 2018-05-19 03:27:08 (4636): Status Report: CPU Time: '95396.765625' 72 2018-05-19 05:07:09 (4636): Status Report: Elapsed Time: '54012.218750' 73 2018-05-19 05:07:09 (4636): Status Report: CPU Time: '107428.953125' 74 2018-05-19 06:47:09 (4636): Status Report: Elapsed Time: '60012.781250' 75 2018-05-19 06:47:09 (4636): Status Report: CPU Time: '119463.421875' 76 2018-05-19 08:27:10 (4636): Status Report: Elapsed Time: '66013.062498' 77 2018-05-19 08:27:10 (4636): Status Report: CPU Time: '131505.375000' 78 2018-05-19 09:59:40 (4636): VM Completion File Detected. 79 2018-05-19 09:59:40 (4636): Powering off VM. 80 2018-05-19 09:59:42 (4636): Successfully stopped VM. 81 2018-05-19 09:59:47 (4636): Deregistering VM. (boinc_cbf3fadcc7133493, slot#5) 82 2018-05-19 09:59:47 (4636): Removing virtual disk drive(s) from VM. 83 2018-05-19 09:59:47 (4636): Removing network bandwidth throttle group from VM. 84 2018-05-19 09:59:47 (4636): Removing storage controller(s) from VM. 85 2018-05-19 09:59:47 (4636): Removing VM from VirtualBox. 86 09:59:52 (4636): called boinc_finish(0) 87 </stderr_txt> 88 ]]> Which is the part of the log which displays the period of the 'elapsed time' (begin and start) ?(Put the range of numbers of the rank line) Where can you determine the idle period of other cores ? Does the 'design' mean that the downloading time for initialising the work unit and the uploading time for the result are not included in the run elapsed time , to enable a right comparison with other hosts inside CERN ? |
|
8)
Message boards :
ATLAS application :
only half of credit for 4-core task - compared to 2-core task
(Message 35305)
Posted 19 May 2018 by PHILIPPE Post: In order to compare the cpu efficiency for Erich's host trying various kinds of work units (1,2,4), i noticed that the cpu efficiency doesn't vary a lot. Here are the results sorted by ascending cpu efficiency : number core run time cpu time efficiency 1 47007,97 44610,45 0,949 4 31546,23 119886,4 0,950 4 37895,95 144711,5 0,955 4 44632,33 172579,6 0,967 1 41378,81 40631,08 0,982 2 74844,05 147679,5 0,987 2 72754,72 143628,0 0,987 2 79614,12 157255,7 0,988 2 78678,92 155415,1 0,988 2 64573,41 127711,8 0,989 2 74159,96 146688,2 0,989 2 61593,39 121835,8 0,989 2 73680,94 145783,3 0,989 2 64629,23 127894,8 0,989 2 85418,61 169112,1 0,990 2 67725,97 134096,9 0,990 1 41229,42 40820,41 0,990 1 50321,02 49826,94 0,990 2 87529,05 173571,6 0,992 2 77997,69 154714,0 0,992 2 71624,45 142076,7 0,992 1 39428,77 39120,66 0,992 2 79781,58 158398,6 0,993 1 43358,44 43116,78 0,994 1 86106,36 85862,92 0,997 1 45956,41 45835,34 0,997 1 85784,28 85584,03 0,998 1 49587,36 49474,27 0,998 1 42208,95 42114,27 0,998 1 85663,14 85541,05 0,999 1 97108,11 96985,05 0,999 1 91747,84 91634,41 0,999 1 43893,34 43850,02 0,999 1 46324,81 46289,48 0,999 1 102843,97 102784,2 0,999 1 87262,61 87229,83 1,000 1 42315,73 42325,23 1,000 1 43034,16 43047,48 1,000 1 43995,33 44016,30 1,000 1 50125,30 50162,84 1,001 1 52159,14 52225,02 1,001 1 90593,39 90741,92 1,002 2 63862,58 128394,1 1,005 1 40409,09 41362,59 1,024 If you see the bottom of the results , there are cpu efficiency values greater than 1.(Not realistic at all)... So i think, the way , the run time and the cpu times values are calculated is not so accurate. For me , the run time should be checked by taking the time of the last line in the log less the time of the first line in the log , multiplied by the cpu percentage of use (throttle), if the work unit has not been paused or restarted.( with substraction of pauses times multiplied by percentage cpu use in preference for other work units paused or restarted) It's not so important but it may have a big influence if CERN choices are made following cpu efficiency values. Questions : *What is the component which evaluates these values (boinc client , boinc server , virtualbox , other component hidden) ? *How are calculated these values ? *Are there other persons who notice the same behavior with their host to make us aware if only erich's host has this type of trouble ,or if it's only windows with virtualbox , and or linux and darwin hosts , too ? |
|
9)
Message boards :
ATLAS application :
what's the average share of finished tasks with hits created?
(Message 35220)
Posted 10 May 2018 by PHILIPPE Post: In order to help people to understand what is happening , face to troubles encountered (hits files missing,...),i choose several graphs from the dashboard. All the plots are made during a sliding period of one week. Time evolution of success and failure jobs : Pie graph in percentage : Pie graph of the causes of failure jobs sorted by exitcodes : More detailed exitcodes by number of cores : More detailed transformation exitcodes by number of cores : Failed jobs by number of cores : Observations : If someone has the meaning of the exitcodes , he should give the information to other people of the forum. It may be sorted , distinguishing the server side failure and the client boinc failure , to enable volunteer to repair their host(s) if the troubles come from their host(s). What is the difference between execution and transformation (for exitcodes)? For tullio's host , his logs reveals an exitcode 65 : 2018-05-07 01:54:41 (7388): Guest Log: ATHENA_PROC_NUMBER=2 2018-05-07 01:54:41 (7388): Guest Log: Starting ATLAS job. (PandaID=3920314561 taskID=13910415) 2018-05-07 02:05:02 (7388): Guest Log: log_extracts: 2018-05-07 02:05:02 (7388): Guest Log: - Last 10 lines from /home/atlas01/RunAtlas/Panda_Pilot_3446_1525650883/PandaJob/athena_stdout.txt - 2018-05-07 02:05:02 (7388): Guest Log: PyJobTransforms.trfExe.preExecute 2018-05-07 01:57:19,134 INFO Batch/grid running - command outputs will not be echoed. Logs for EVNTtoHITS are in log.EVNTtoHITS 2018-05-07 02:05:02 (7388): Guest Log: PyJobTransforms.trfExe.preExecute 2018-05-07 01:57:19,136 INFO Now writing wrapper for substep executor EVNTtoHITS 2018-05-07 02:05:02 (7388): Guest Log: PyJobTransforms.trfExe._writeAthenaWrapper 2018-05-07 01:57:19,136 INFO Valgrind not engaged 2018-05-07 02:05:02 (7388): Guest Log: PyJobTransforms.trfExe.preExecute 2018-05-07 01:57:19,137 INFO Athena will be executed in a subshell via ['./runwrapper.EVNTtoHITS.sh'] 2018-05-07 02:05:02 (7388): Guest Log: PyJobTransforms.trfExe.execute 2018-05-07 01:57:19,137 INFO Starting execution of EVNTtoHITS (['./runwrapper.EVNTtoHITS.sh']) 2018-05-07 02:05:02 (7388): Guest Log: PyJobTransforms.trfExe.execute 2018-05-07 02:02:29,204 INFO EVNTtoHITS executor returns 65 2018-05-07 02:05:02 (7388): Guest Log: PyJobTransforms.trfExe.validate 2018-05-07 02:02:30,113 ERROR Validation of return code failed: Non-zero return code from EVNTtoHITS (65) (Error code 65) 2018-05-07 02:05:02 (7388): Guest Log: PyJobTransforms.trfExe.validate 2018-05-07 02:02:30,149 INFO Scanning logfile log.EVNTtoHITS for errors 2018-05-07 02:05:02 (7388): Guest Log: PyJobTransforms.transform.execute 2018-05-07 02:02:30,438 CRITICAL Transform executor raised TransformValidationException: Non-zero return code from EVNTtoHITS (65); Logfile error in log.EVNTtoHITS: "AthMpEvtLoopMgr FATAL makePool failed for AthMpEvtLoopMgr.SharedEvtQueueProvider" 2018-05-07 02:05:02 (7388): Guest Log: PyJobTransforms.transform.execute 2018-05-07 02:02:33,655 WARNING Transform now exiting early with exit code 65 (Non-zero return code from EVNTtoHITS (65); Logfile error in log.EVNTtoHITS: "AthMpEvtLoopMgr FATAL makePool failed for AthMpEvtLoopMgr.SharedEvtQueueProvider") For Erich's host , no exit code , so the problem may be different. And sorry , but the graph showing the results divided by version of virtualbox doesn't exist. (It would enable to see if the choice of the virtualbox version has an influence on the behavior of results, if someone has a doubt in it). |
|
10)
Message boards :
ATLAS application :
Wrong WU ?
(Message 35088)
Posted 24 Apr 2018 by PHILIPPE Post: Here is a post from David Cameron which explains how to do : We have added some information on the processed events in ATLAS tasks on consoles inside the VM. Some improvement have been made since this time but the way to do hasn't changed... F1 --> console 1 F2 --> console 2 and so on ... |
|
11)
Message boards :
ATLAS application :
Atlas task failing Computational Error with exceeding disk limit
(Message 34916)
Posted 8 Apr 2018 by PHILIPPE Post: In addition to this (what is the best core configuration?) , the answer is not absolute but depends on your computer ( OS age and type , kind of cpu , amount of ram available , ssd or hdd ,...) and also on your way of crunching ( host dedicated or not , full or partial time to crunch ,only one project at a time or several ones , with or without one or two core idles to give easier the maintenance by your OS, the isp quality and your bandwith, the skillness to understand where a bottleneck appears and how to solve it,...). I found this plot on the dashboard which displays the average cpu efficiency of all the kind of cores configurations executed by all volunteers (for only jobs with success) : over a sliding period of one month. As we can't select options to make a deeper inspection and separate parameters to study their influence on the results , you have to consider it as a merge of global work with Boinc.There is no possibility to give accurate results for a particular host type. The only thing you can do is to compare your situation with the average provided in this plot and appreciate your position (above or below the average). In order to estimate the data volumes which are used to calculate the above average efficiency: over a sliding period of one month. Independently of the graph , i notice that linux native application has a better efficiency than virtual box for a same number of cores and enable 12 cores simultaneously with good results when virtual box is limited to 8 cores because of its lower efficiency. (but it requires more skillness and knowledge to be installed). |
|
12)
Message boards :
Cafe LHC :
Milestones
(Message 33944)
Posted 19 Jan 2018 by PHILIPPE Post: At this level of conversation, one might recall the thought of "pierre de coubertin" : In a competition ,"the most important thing is to participate". More precisely, "The important thing in life is not the triumph but the struggle, the essential thing is not to have conquered but to have fought well". Credits are not the only factor to consider ,other values can be shared in this project (knowledge , culture , informations ,tastes ans mood,...). |
|
13)
Message boards :
CMS Application :
no new WUs available
(Message 33700)
Posted 7 Jan 2018 by PHILIPPE Post: I don't know if there is a link with this opportunistic farm of computers and a discrepancy noticed between informations displayed on project status and application page. On status project : Current GigaFLOPS 59378.42 Task data as of 7 Jan 2018, 11:04:59 UTC on application page : Total average computing: 48,523 GigaFLOPS We deduce a difference of nearly 11 000 GigaFLOPS (variable from 9 000 to 11 000 , since 2 weeks ago~, average 10 000 GigaFlops) Does it mean that the opportunistic farm has this powerfullness ? By the way , it would be good to add lines written "other" in each sub project in application page to include "platform unknown or other platform" to avoid this discrepancy in GigaFLOPS. |
|
14)
Message boards :
LHCb Application :
Low CPU usage
(Message 33662)
Posted 4 Jan 2018 by PHILIPPE Post: Trying to understand what is happening , i found the dirac site which enables users to see LHCb statistics. Here is the cpu usage during a week following job processing types : Here is the cpu efficiency during the same period for the same jobs processing types : It seems that the behavior of the types of job executed is different. Maybe a cern member could speak about it to give us some explanations ? (short summary of these types of job and if these plots traduces with more or less accuracy the issues encountered by crunchers.) (the name of the wus don't enable to identify the type of jobs executed). |
|
15)
Message boards :
Sixtrack Application :
Inconclusive results
(Message 33642)
Posted 3 Jan 2018 by PHILIPPE Post: It may help probably the project , i have found this in the boinc documentation too : Blacklisting hosts To blacklist a host, set its max_results_day field to -1. This will cause all of its scheduler requests to return an error message and do nothing else (no jobs or trickle messages will be sent or received). |
|
16)
Message boards :
Sixtrack Application :
Inconclusive results
(Message 33634)
Posted 2 Jan 2018 by PHILIPPE Post: I think this host has a problem. Only errors while computing, no validation conclusive. Please , do something to stop it. ID: 10517247 An algorythm or script may be interesting to detect these consecutive errors...(more than 30 consecutive errors --> host suspended). |
|
17)
Message boards :
ATLAS application :
No tasks available
(Message 33599)
Posted 31 Dec 2017 by PHILIPPE Post: @AuxRx : Thanks to have expressed your point of view. It 's always important to have different opinions on a same subject , in order to better undestand the environment and to enable other peolple to have an idea on it. |
|
18)
Message boards :
ATLAS application :
No tasks available
(Message 33592)
Posted 31 Dec 2017 by PHILIPPE Post: I can't answer you , Erich , but after having a look at the situation on other crunchers , i find curious that for a same volunteer ,one of its hosts is fullfilled by workunits while another host is waiting to have workunits . It look likes as if , the sharing is not equal inside a same user.( and globally between different users , of course) "Maybe" , it would be advantageous for the project to provide workunits with a lower local buffer as possible to share, in a better way, the jobs among volunteers. Doing this, for instance, by overwriting the local crunchers preferences, because of the reduction of available workunits , the global efficiency of the server would probably increase because
space disk on the server where waiting results are, could be reduced (above all for sixtract which needs 2 results before being validated)
|
|
19)
Message boards :
ATLAS application :
Uploads of finished tasks not possible since last night
(Message 33486)
Posted 23 Dec 2017 by PHILIPPE Post: You are probably right, Erich , the solution found (deleting partial uploads with script every 6 hours) is temporary , untill the use of the new file systems for nfs server. But "maybe" there is another way to wait for this update. Processes et daemons inside the boinc server have different priorities for their execution. Under heavy load ,the partial uploads occur when the "handler of upload" stops one upload because another process with a higher priority or a same priority is running , creating a conflict which perturbs the upload and stopping it , finally,before its normal end. (I don't speak about isp failure or client computer crash which are external causes.) "Maybe" , to attenuate the problem , it would be worth giving
a higher priority to the deleter face to the transitionner (the most cpu intensive) (in order to clean and bring more space) , and a lower priority to the feeder and why not also to the scheduler .
|
|
20)
Message boards :
ATLAS application :
Uploads of finished tasks not possible since last night
(Message 33426)
Posted 17 Dec 2017 by PHILIPPE Post: @ csbyseti Don't know how server side Boinc works It 's true this part of the boinc project is not clearly described (at least the general guidelines should appear somewhere to explain to volunteers what means the terms encountered in the status server project page) so i found a short summary on the net : 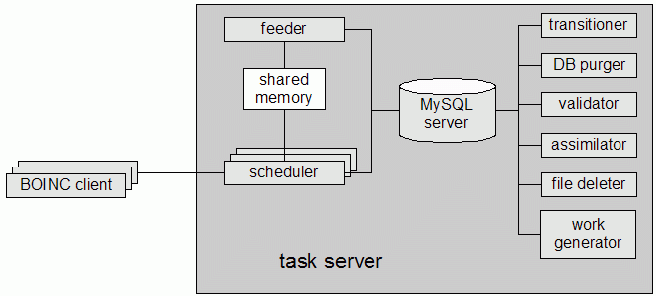 Taskserver (or scheduling server) in details: The scheduler handles requests from BOINC clients The feeder caches jobs which are not yet transmitted The transitioner examines jobs for which a state change has occurred and handles this change The database purger removes jobs and instance database entries that are no longer needed The validator compares the instances of a work unit The assimilator handles tasks which are done The file deleter deletes input and output files that are no longer needed The work generator creates new jobs and their input files Unfortunately ,the only component missing in this picture is the the file upload handler which is not linked to database storage but i found a picture on the net (slides n° 5) where its functioning is explained (slides n° 22 - 24). Server directory structure The directory structure for a typical BOINC project looks like: PROJECT/
bin/ cgi-bin/ log_HOSTNAME/ pid_HOSTNAME/ download/ html/ inc/ ops/ project/ stats/ user/ user_profile/ keys/ upload/
bin: server daemons and programs. cgi-bin: CGI programs log_HOSTNAME: log output pid_HOSTNAME: lock files, pid files download: storage for data server downloads. html: PHP files for public and private web interfaces keys: encryption keys upload: storage for data server uploads.
|

Next 20

©2024 CERN